Difference between revisions of "VALT Manual Reports"
IVSWikiBlue (talk | contribs) |
IVSWikiBlue (talk | contribs) m |
||
| (6 intermediate revisions by the same user not shown) | |||
| Line 1: | Line 1: | ||
| − | + | {{Article - Manual | content = | |
| − | < | + | <h1>Introduction</h1> |
| + | Reports are used to organize data from the system and display it in an easy-to-read format. | ||
| + | |||
| + | {{img - resize | file = VALT 6.3 Manual-Reports 00.png}} | ||
| + | |||
| + | {{img - resize | file = VALT 6.3 Manual-Reports 02.png}} | ||
| + | {{hr}} | ||
| + | |||
| + | <h1>Navigation</h1> | ||
| + | |||
| + | {{Manual lvl 2 | title = Date Range | content = Filters results to display only reports created during a certain date range.}} | ||
| + | |||
| + | |||
| + | {{Top of Page}} | ||
| + | {{hr}} | ||
| + | |||
| + | {{Manual lvl 2 | title = Search | content = This is used to narrow results; the search box applies to all information associated with reports.}} | ||
| + | |||
| + | |||
| + | {{Top of Page}} | ||
| + | {{hr}} | ||
| + | {{Manual lvl 2 | title = Filters | content = Filter buttons can be used to display only certain Report Types (Review Time, Evaluation, Information, etc.)}} | ||
| + | |||
| + | |||
| + | {{Top of Page}} | ||
| + | {{hr}} | ||
| + | |||
| + | <h1>Add Report</h1> | ||
| + | |||
| + | Click the plus button to begin creating a new report. | ||
| + | |||
| + | {{Manual lvl 2 | title = Information | content = Report Name and Report Type are required in every report. Evaluation, Information, and Comment Reports will prompt for additional fields to be completed.}} | ||
| + | |||
| + | |||
| + | {{Top of Page}} | ||
| + | {{hr}} | ||
| + | |||
| + | {{Manual lvl 2 | title = Rooms | content = Select which room or rooms to include in the report.}} | ||
| + | |||
| + | |||
| + | {{Top of Page}} | ||
| + | {{hr}} | ||
| + | |||
| + | {{Manual lvl 2 | title = Recordings | content = Include either all recordings for the given rooms, or select only certain recordings to include in the report.}} | ||
| + | |||
| + | |||
| + | {{Top of Page}} | ||
| + | {{hr}} | ||
| + | |||
| + | {{Manual lvl 2 | title = Users | content = Select which users' or user groups' recordings to include in this report.}} | ||
| + | |||
| + | |||
| + | {{Top of Page}} | ||
| + | {{hr}} | ||
| + | |||
| + | {{Manual lvl 2 | title = Dates | content = Select a quick date or a date range from which to pull recordings for the report.}} | ||
| + | |||
| + | |||
| + | {{Top of Page}} | ||
| + | {{hr}} | ||
| + | |||
| + | <h1>Edit Report</h1> | ||
| + | |||
| + | Hover over an existing report and select the pencil icon to modify the parameters for the report. | ||
| + | |||
| + | |||
| + | {{Top of Page}} | ||
| + | {{hr}} | ||
| + | |||
| + | <h1>Delete Report</h1> | ||
| + | |||
| + | Hover over an existing report and select the trash can icon to permanently delete the report. | ||
| + | |||
| + | |||
| + | {{Top of Page}} | ||
| + | {{hr}} | ||
| + | |||
| + | <h1>Multi-Select</h1> | ||
| + | |||
| + | This is used to select multiple reports at once. | ||
| + | |||
| + | |||
| + | {{Manual lvl 2 | title = Delete Multiple Reports| content = Selected items can be deleted en masse.}} | ||
| + | |||
| + | |||
| + | {{Top of Page}} | ||
| + | {{hr}} | ||
| + | |||
| + | <h1>Report Details</h1> | ||
| + | |||
| + | {{img - resize | file = VALT 6.3 Manual-Reports 01.png}} | ||
| + | |||
| + | |||
| + | {{Manual lvl 2 | title = Group Data by Users | content = This option can be selected to show the groups as data points on the graph.}} | ||
| + | |||
| + | |||
| + | {{Top of Page}} | ||
| + | {{hr}} | ||
| + | |||
| + | {{Manual lvl 2 | title = Group Data by Groups | content = This option can be selected to show the individual users as data points on the graph.}} | ||
| − | |||
| − | |||
| − | |||
| − | |||
| − | |||
| − | |||
| − | |||
| − | |||
| − | + | {{Top of Page}} | |
| + | {{hr}} | ||
| − | {{ | + | {{Manual lvl 2 | title = Alter Date Range | content = Filters results to display only data from a certain date range.}} |
| − | |||
| − | |||
| − | |||
| − | }} | ||
| − | |||
| − | {{ | + | {{Top of Page}} |
| − | + | {{hr}} | |
| − | }} | ||
| − | == | + | {{Manual lvl 2 | title = Alter Interval | content = Shows Hourly, Daily, or Monthly intervals on the graph.}} |
| − | |||
| − | |||
| − | |||
| − | |||
| − | + | {{Top of Page}} | |
| − | + | {{hr}} | |
| − | {{ | + | {{Manual lvl 2 | title = Timeline | content = Click or Drag to view data points along the timeline.}} |
| − | |||
| − | }} | ||
| − | |||
| − | |||
| − | {{ | + | {{Top of Page}} |
| − | |||
| − | |||
| − | |||
| − | |||
| − | |||
}} | }} | ||
[[Category:VALT]] | [[Category:VALT]] | ||
| + | [[Category:VALT 6.3]] | ||
[[Category:User Training]] | [[Category:User Training]] | ||
Latest revision as of 11:25, 17 March 2025
Introduction
Reports are used to organize data from the system and display it in an easy-to-read format.
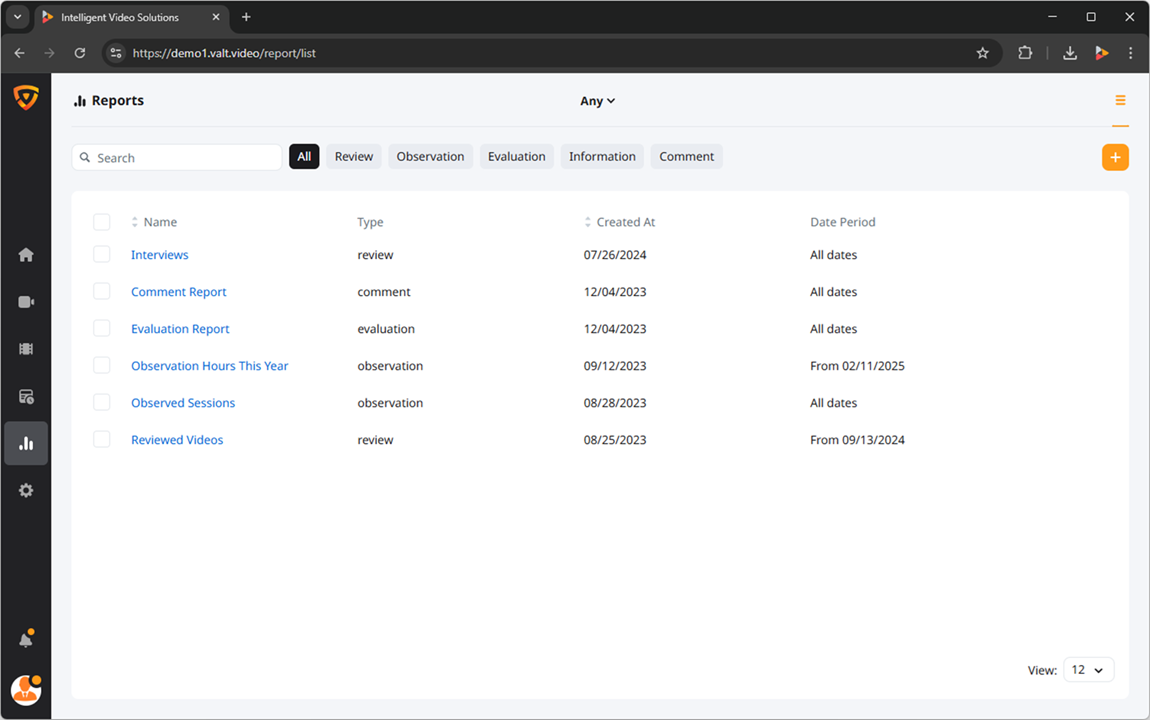
Date Range
Filters results to display only reports created during a certain date range.
Search
This is used to narrow results; the search box applies to all information associated with reports.
Filters
Filter buttons can be used to display only certain Report Types (Review Time, Evaluation, Information, etc.)
Add Report
Click the plus button to begin creating a new report.
Information
Report Name and Report Type are required in every report. Evaluation, Information, and Comment Reports will prompt for additional fields to be completed.
Rooms
Select which room or rooms to include in the report.
Recordings
Include either all recordings for the given rooms, or select only certain recordings to include in the report.
Users
Select which users' or user groups' recordings to include in this report.
Dates
Select a quick date or a date range from which to pull recordings for the report.
Edit Report
Hover over an existing report and select the pencil icon to modify the parameters for the report.
Delete Report
Hover over an existing report and select the trash can icon to permanently delete the report.
Multi-Select
This is used to select multiple reports at once.
Delete Multiple Reports
Selected items can be deleted en masse.
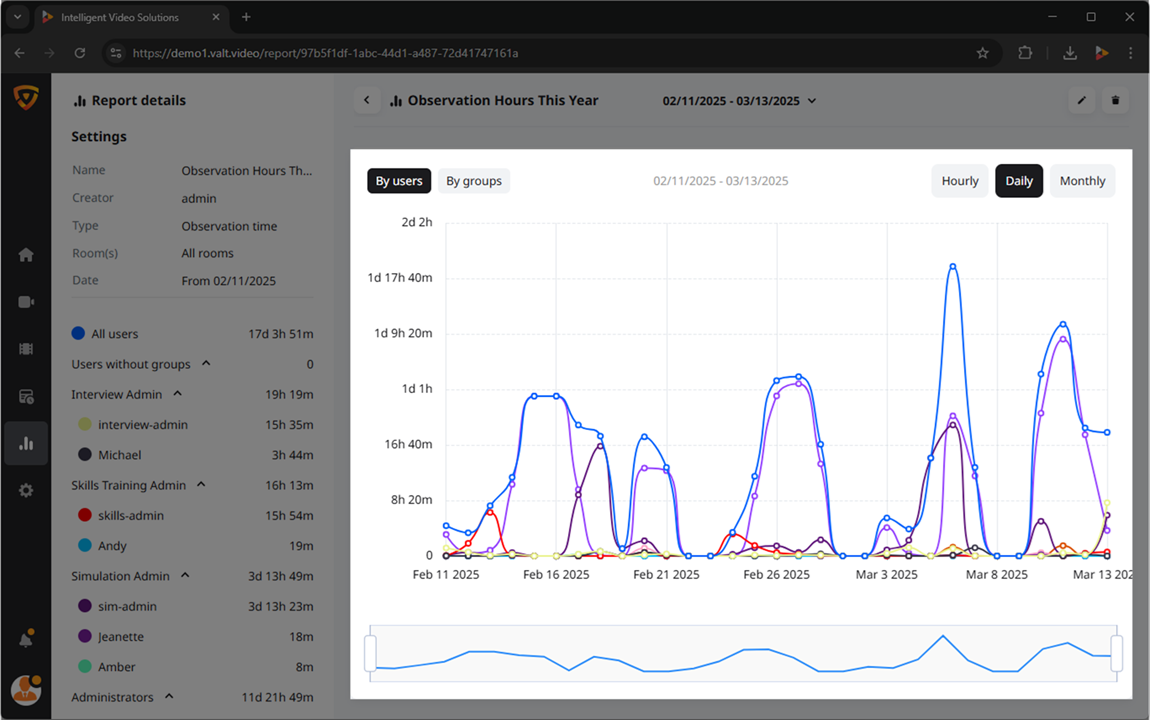
Report Details
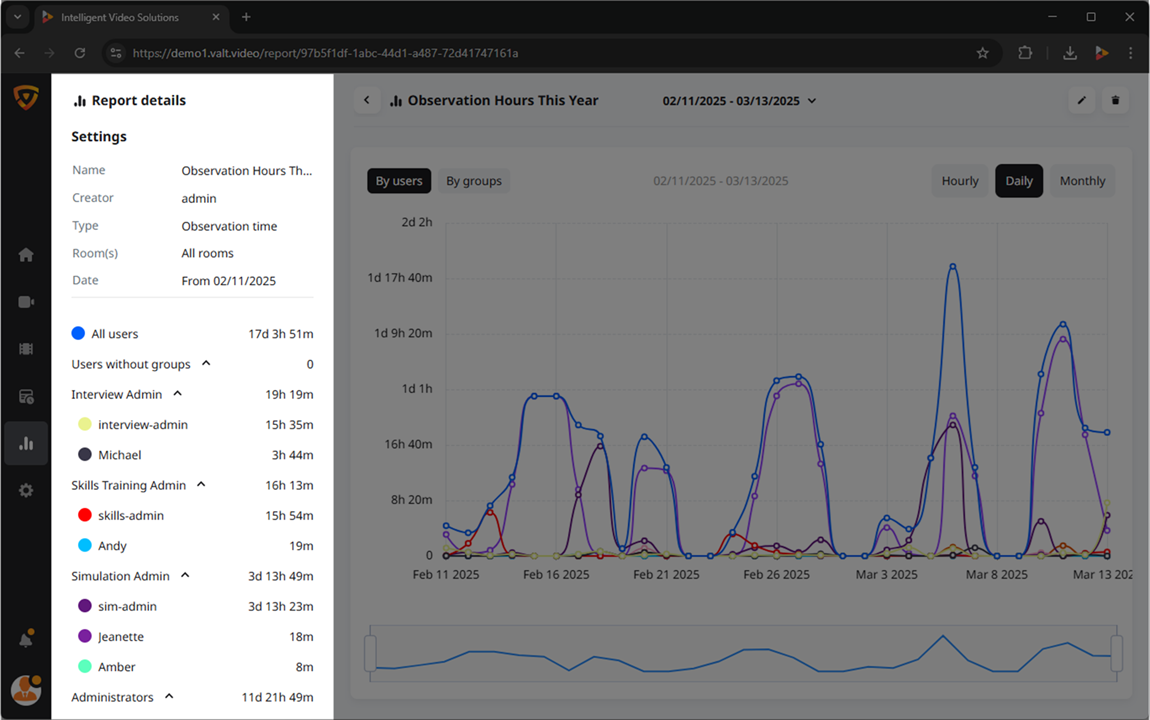
Group Data by Users
This option can be selected to show the groups as data points on the graph.
Group Data by Groups
This option can be selected to show the individual users as data points on the graph.
Alter Date Range
Filters results to display only data from a certain date range.
Alter Interval
Shows Hourly, Daily, or Monthly intervals on the graph.
Timeline
Click or Drag to view data points along the timeline.