Difference between revisions of "VALT Manual Reports"
IVSWikiBlue (talk | contribs) (→Room(s)) |
IVSWikiBlue (talk | contribs) (→Reports) |
||
| (6 intermediate revisions by the same user not shown) | |||
| Line 1: | Line 1: | ||
=Reports= | =Reports= | ||
| − | Reports are used to parse data from the system. Three types of reports are available: '''Usage''', '''Information''' and '''Alerts'''. | + | <div class='floating_card'>Reports are used to parse data from the system. Three types of reports are available: '''Usage''', '''Information''' and '''Alerts'''.</div> |
| − | + | {{img with key | file = Reports1.jpg | list = | |
| − | + | <li>New Report: clicking on this button will bring up the new report menu.</li> | |
| − | + | <li>Search: this is used to narrow results, the search box applies to all information associated with reports.</li> | |
| − | + | <li>Report Type: filter the displayed reports based on type using this drop down menu.</li> | |
| − | + | <li>View Mode: allows a user to toggle between list and thumbnail report view modes.</li> | |
| − | + | <li>Data Links: clicking on the data links will take the user to the corresponding data set (within logs or review sections).</li> | |
| − | + | <li>Report Name: clicking on the report name will bring up the report graph.</li> | |
| − | + | }} | |
==Information== | ==Information== | ||
| − | + | {{img with key | file = Reports-4.jpg | list = | |
| − | + | <li>Report Name: used to name the report, this name should be descriptive.</li> | |
| − | + | <li>Report Type: the report can be '''Information''', '''Usage''', '''Marker''' , '''Evaluation''' or '''Alert''' the sections below will toggle based on the selected report type.</li> | |
| − | + | <li>Report Info: select information or marker fields at assign matching data.</li> | |
| − | + | }} | |
==Room(s)== | ==Room(s)== | ||
| − | + | {{img with key | file = Reports-5.jpg | list = | |
| − | + | <li>Select rooms to include in this report, note leaving this section blank will include all rooms.</li> | |
| − | + | }} | |
==User(s)== | ==User(s)== | ||
| − | + | {{img with key | file = Reports-6.jpg | list = | |
| − | + | <li>Search: narrow list based on user or user group.</li> | |
| − | + | <li>Select user(s) or user group(s) recordings to include in this report, note leaving this section blank will include '''all users recordings'''.</li> | |
| − | + | }} | |
==Thumbnail View== | ==Thumbnail View== | ||
| − | The report thumbnail view provides much of the report related information in a thumbnail layout as shown below. | + | <div class='floating_card'>The report thumbnail view provides much of the report related information in a thumbnail layout as shown below.</div> |
| − | + | {{img with key | file = Reports-2.jpg | list = | |
| − | + | <li>Clicking on the report tile will bring up the report graph.</li> | |
| − | + | }} | |
==Report Graph== | ==Report Graph== | ||
| − | The report graph provides a line graph version of the data set. Clicking on individual dots will pull up the corresponding data. | + | <div class='floating_card'>The report graph provides a line graph version of the data set. Clicking on individual dots will pull up the corresponding data.</div> |
| − | |||
| − | |||
| − | + | {{img with key | file = Reports-3.jpg | list = | |
| − | + | <li>Edit: allows a user to edit the report information. </li> | |
| − | + | <li>Delete: removes the report.</li> | |
| − | + | <li>Title: displays the report name.</li> | |
| − | + | <li>Export: exports the graphical report to pdf or xls.</li> | |
| + | <li>The dots on the line graph represent data points, hovering over the dots will provide information as shown below. If corresponding video exists clicking on any of the dots will pull up linked videos in the review section of the application.</li> | ||
| + | }} | ||
Latest revision as of 09:39, 18 October 2022
Reports
Reports are used to parse data from the system. Three types of reports are available: Usage, Information and Alerts.
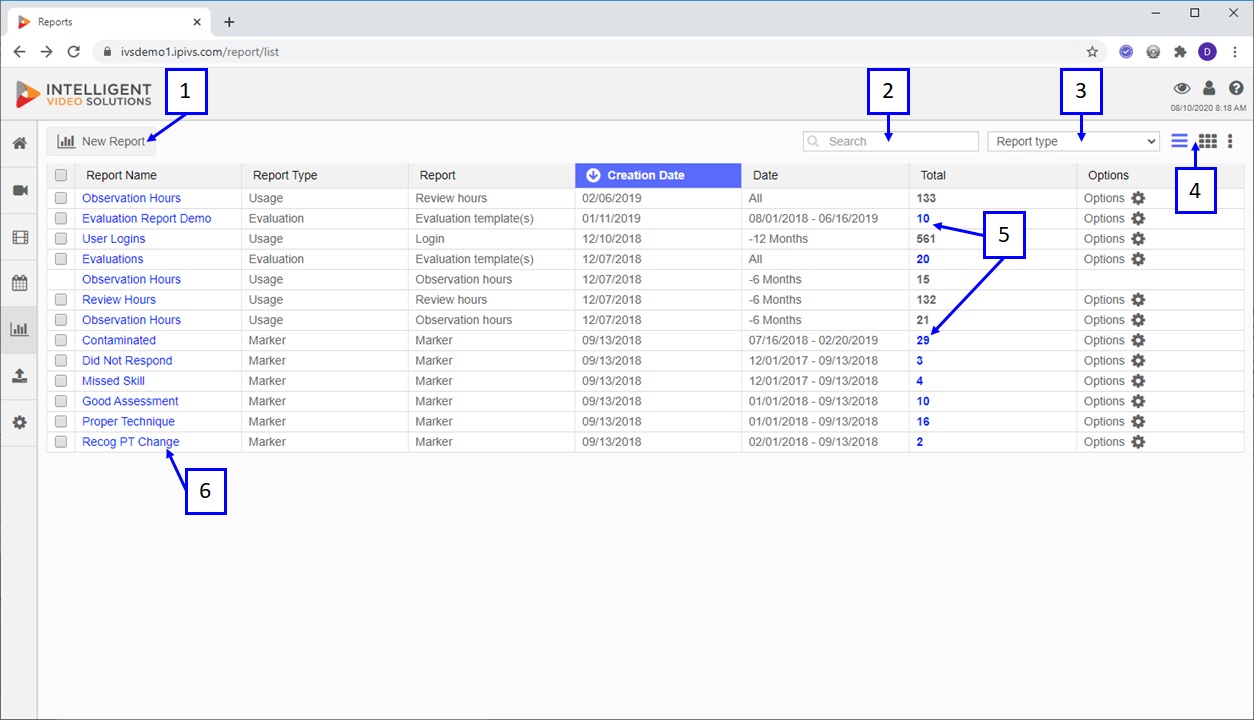
- New Report: clicking on this button will bring up the new report menu.
- Search: this is used to narrow results, the search box applies to all information associated with reports.
- Report Type: filter the displayed reports based on type using this drop down menu.
- View Mode: allows a user to toggle between list and thumbnail report view modes.
- Data Links: clicking on the data links will take the user to the corresponding data set (within logs or review sections).
- Report Name: clicking on the report name will bring up the report graph.
Information
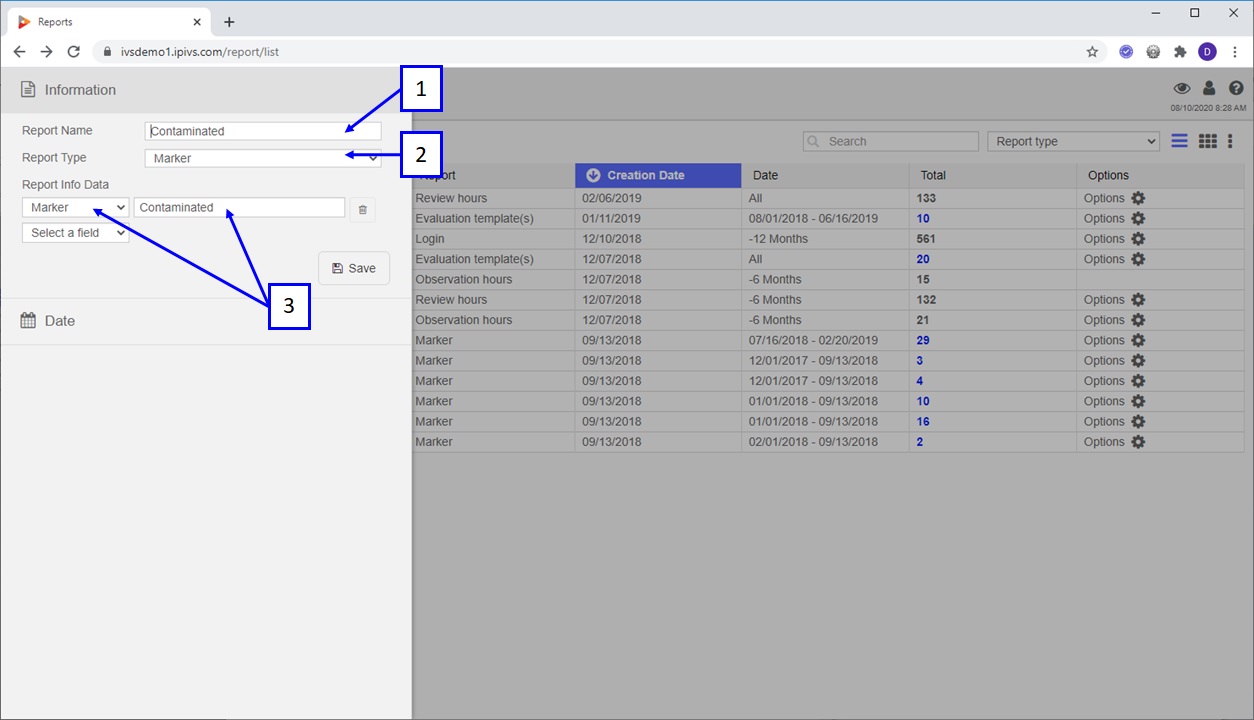
- Report Name: used to name the report, this name should be descriptive.
- Report Type: the report can be Information, Usage, Marker , Evaluation or Alert the sections below will toggle based on the selected report type.
- Report Info: select information or marker fields at assign matching data.
Room(s)
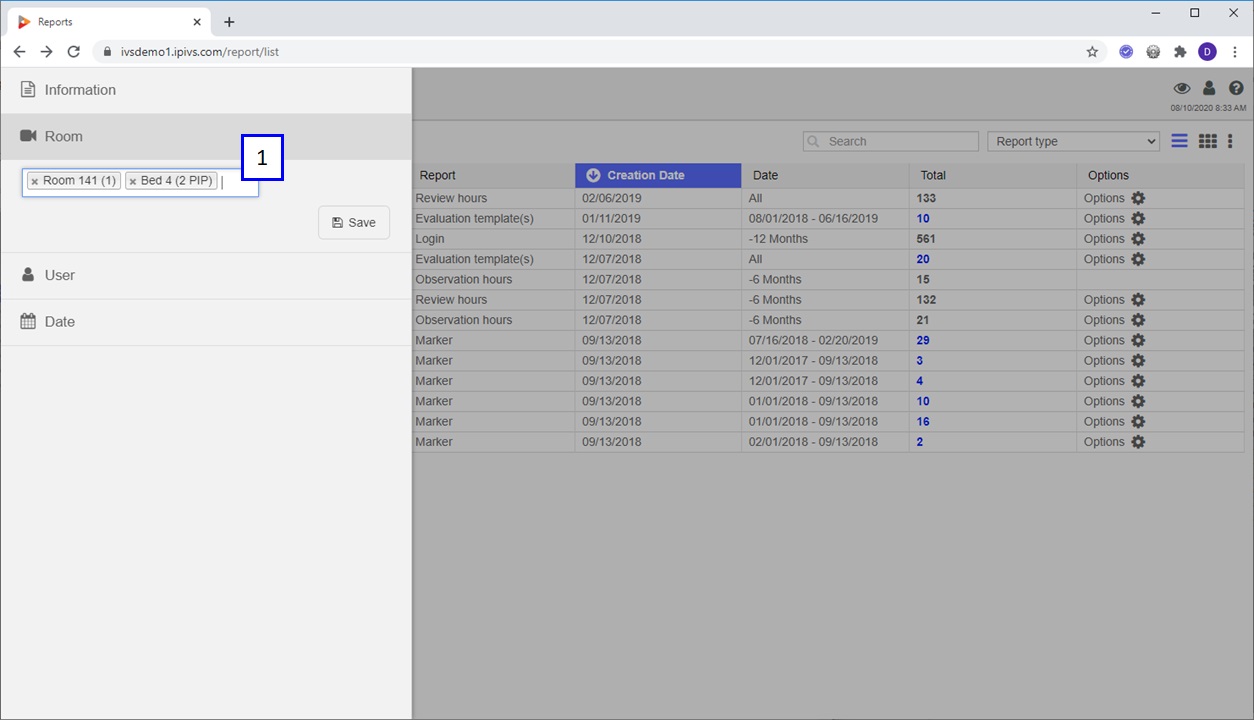
- Select rooms to include in this report, note leaving this section blank will include all rooms.
User(s)
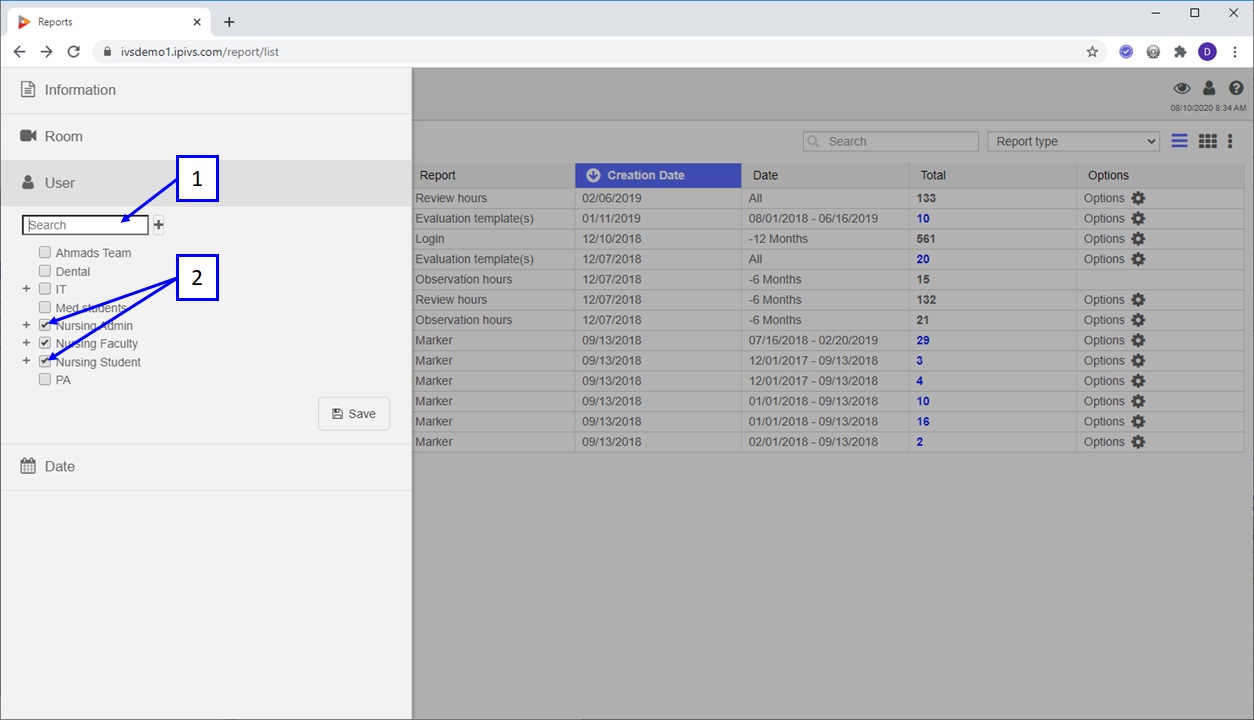
- Search: narrow list based on user or user group.
- Select user(s) or user group(s) recordings to include in this report, note leaving this section blank will include all users recordings.
Thumbnail View
The report thumbnail view provides much of the report related information in a thumbnail layout as shown below.
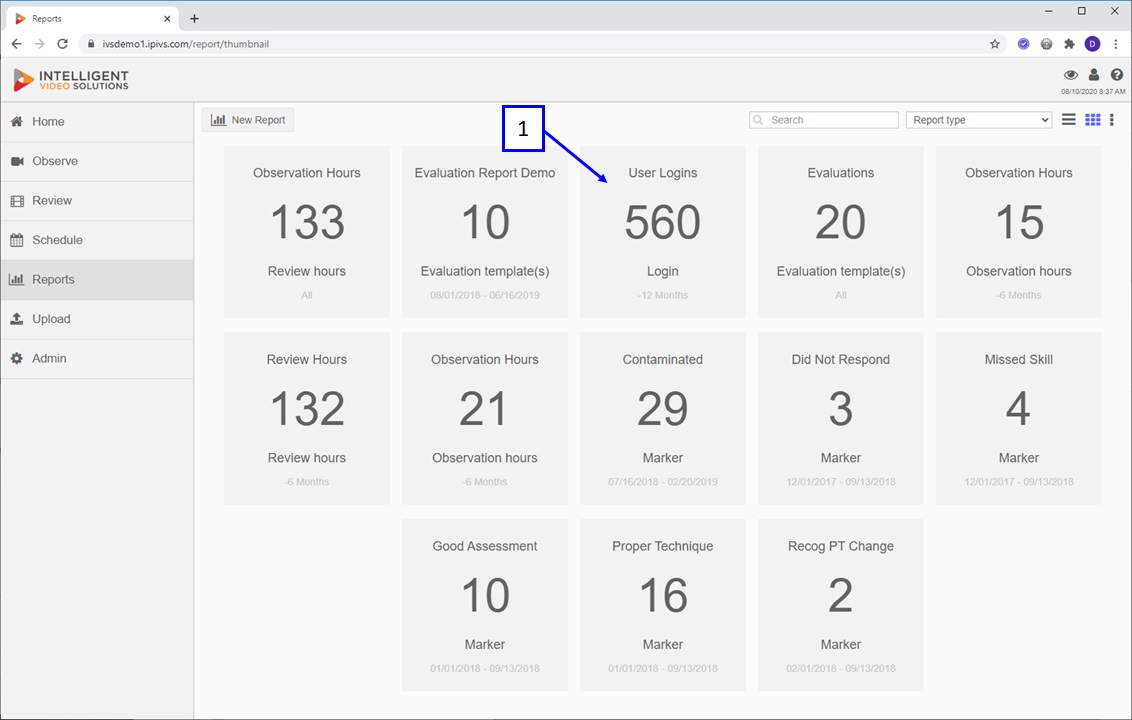
- Clicking on the report tile will bring up the report graph.
Report Graph
The report graph provides a line graph version of the data set. Clicking on individual dots will pull up the corresponding data.
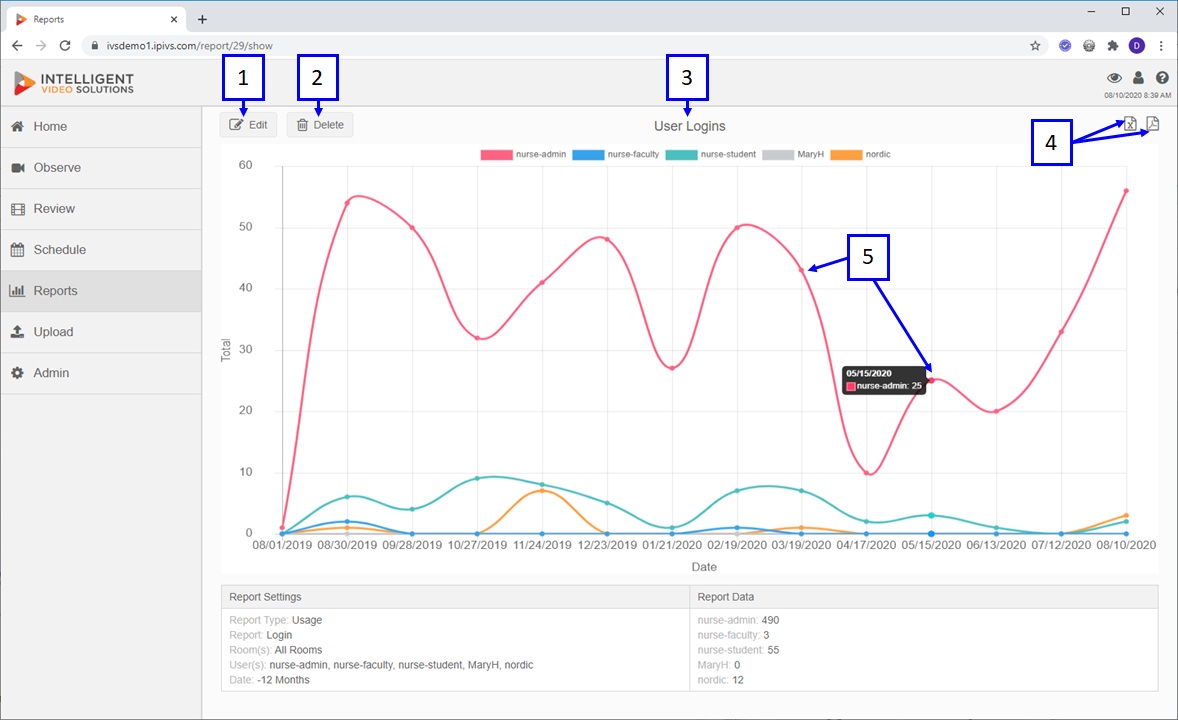
- Edit: allows a user to edit the report information.
- Delete: removes the report.
- Title: displays the report name.
- Export: exports the graphical report to pdf or xls.
- The dots on the line graph represent data points, hovering over the dots will provide information as shown below. If corresponding video exists clicking on any of the dots will pull up linked videos in the review section of the application.